Introductions
In this article I will demonstrate how to quickly setup a Splunk lab environment using Docker, install the Cisco Nexus Dashboard plugins, and configure Splunk to ingest NDI API data into its GUI interface.
Requirements and VM Setup

1 VM running your Linux distro of choice with the following HW:
CPU – 16 vCPUs
RAM – 16gb
HDD – 40GB
Once we have installed our Linux distro and configured and IP. We need to install docker to run our Splunk Container
I am using an Ubuntu 20.04 as my distro, and do not need to configure any additional repos in order to successfully install the latest version of Docker. You may need to set this up if you are using a distro like CentOS.
sudo apt-get update -y

sudo apt-get install docker.io -y

sudo usermod -aG docker cisco
You will need to logout and login again for this user group to take effect in your terminal sessions. If you have successfully configured your local user under the docker group you should be able to execute “docker info” without any permission errors or need to add sudo.
Splunk Installation
https://hub.docker.com/r/splunk/splunk/#quickstart
Installing Splunk into our docker VM is extremely easy, we can do so by issuing 2 commands and like magic we have a Splunk Enterprise installation that we can begin to configure to integrate with Cisco NDI.
First we will pull the image:
docker pull splunk/splunk:latest
Then we will start our container. Be sure to change the password to something that conforms to Splunks Password standards. A URL to the password requirements can be found below:
https://docs.splunk.com/Documentation/Splunk/latest/Security/Configurepasswordsinspecfile

docker run -d -p 8000:8000 -e "SPLUNK_START_ARGS=--accept-license" -e "SPLUNK_PASSWORD=<password>" --name splunk splunk/splunk:latest
I did not need to make any additional changes to my configuration, though if you wanted a more “Enterprise” deployment you could read through the Splunk Docker docs and configure some docker volumes for persistent storage. We will not be covering that configuration in this article, but a link is provided below.
https://splunk.github.io/docker-splunk/STORAGE_OPTIONS.html
Once the container has started successfully we will be able to access the Splunk GUI by navigating to our VM’s IP address and port 8000. Then login with admin/<Your Password inputted during “docker run”>
http://<IP>:8000

Once logged into Splunk we can begin to install the necessary plugins needed to connect the two platforms. We can do this by navigating the Splunk plugin marketplace.


In my environment I have the plugins installed, for a fresh setup you click the green install button and input your Splunk account information that you created on splunk.com.


Once installed we will need to setup the plugins. There is only one plugin to setup, this plugin installs the scripts that poll NDI for the data as well as storing the NDI login information.
NOTE: IF YOU HAVE UNSIGNED NDI CERTS LIKE MANY LABS. YOU WILL NEED TO DISABLE SSL VERIFICATION IN OUR PLUGIN CONFIGURATION INSIDE OF THE DOCKER CONTAINER. STEPS BELOW
- Find the docker container name
cisco@splunk-host:~$ docker ps

CONTAINER ID   IMAGE                  COMMAND                  CREATED        STATUS                  PORTS                                                                                              NAMES

a1612532b32e   splunk/splunk:latest   "/sbin/entrypoint.sh…"   17 hours ago   Up 16 hours (healthy)   8065/tcp, 8088-8089/tcp, 8191/tcp, 9887/tcp, 0.0.0.0:8000->8000/tcp, :::8000->8000/tcp, 9997/tcp   splunk
- Gain access to container CLI
cisco@splunk-host:~$ docker exec -it a1612532b32e bash
- Become root user inside of container
[ansible@a1612532b32e var]$ sudo -i
- Change directory to the directory shown below in the command.
[root@a1612532b32e splunk]# cd etc/apps/TA_cisco-NI/bin
- Change the following line as shown in the README.md
* If you want to disable SSL Connection, then follow the below steps:

* Navigate to folder $SPLUNK_HOME$/etc/apps/TA_cisco-NI/bin

* Change the value of `VERIFY_SSL` from `True` to `False` in the cisco_ni_constants.py file (Line Number 4).
- Use your textedit of choice to edit and save the file after you have made the necessary changes.
[root@a1612532b32e bin]# vi cisco_ni_constants.py

1 COUNT = 100

2 NUMBER_OF_THREADS = 16

3 TIMEOUT = 180

4 VERIFY_SSL = False
- It is also good practice to change the minimum disk warnings. You could use my options if you copied my VM HDD specs. You will have to restart the Splunk process inside the container. This does not restart the container.
[root@a1612532b32e ~]# cd /opt/splunk/bin/

[root@a1612532b32e bin]# ./splunk set minfreemb 1000

[root@a1612532b32e bin]# ./splunk restart
- You are finished, no need to worry about restarting the Splunk container. Simply exit out of the container which you will need to do twice since we became the root user.
[root@a1612532b32e bin]# exit

logout

[ansible@a1612532b32e var]$ exit

exit

cisco@splunk-host:~$
Configuring our Plugin Applications
To begin this configuration, navigate to the Cisco Nexus Dashboard Insights Add-On plugin. You can navigate by going to the Splunk home or from the Apps drop down on the top navigation bar.


Once in the Cisco Nexus Dashboard Insights Add-On GUI, we can navigate to the configuration tab and add our NDI login information.

You will be asked to provide login information for a user with API access.

Once successfully configured you should see the account appear in the GUI.

Now we need to configure our input stream. To configure these input stream will navigate to the “Inputs” tab in the Cisco Nexus Dashboard Insights Add-On GUI. Just like adding our NDI account information, we will hit the green Add button to create our Input data.

You will need to create 2 different Input rules at a minimum to see both Advisories and Anomalies. You can simply just utilize the default values if you want to just get any data into our Splunk system. Be sure to choose your previously created global account.

After we have inputted 2 rules for Advisors and Anomalies, we will need to wait sometime for polling to take place and data to populate. This can take up to 15minutes. However, you will not see the data in the Cisco Nexus Dashboard Insights Add-On GUI. You will need change to the other Splunk plugin we installed – Cisco Nexus Dashboard Insights App.
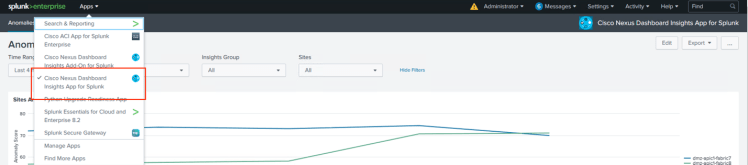
If your setup was successful, you should now see graphs and data from your Nexus Dashboard Insights App.

Hi Soumitra
the path inside the splunk container to update the cisco_ni_constants.py script is
/opt/splunk/etc/apps/TA_cisco-NI/bin